The top metrics for tracking performance and improving future events. Supports data-driven decision making.
In today's competitive event landscape, success isn't just measured by applause or positive feedback. Modern event professionals need concrete data to understand what worked, what didn't, and how to optimize future experiences. Whether you're organizing corporate conferences, trade shows, or networking events, tracking the right metrics transforms gut feelings into actionable insights.
At Venzi, we understand that data-driven decision making is the cornerstone of exceptional event management. Let's explore the essential metrics every event organizer should track to measure success and drive continuous improvement.
Pre-Event Metrics: Setting the Foundation
Registration and Marketing Performance
Registration Rate: Track the percentage of people who register after viewing your event page or receiving invitations. A healthy registration rate typically ranges from 20-30% for corporate events.
Marketing Channel Effectiveness: Measure which channels drive the most registrations. Monitor email open rates (aim for 20-25%), social media engagement, and website traffic to identify your most valuable marketing investments.
Early Bird vs. Regular Registration Ratio: This metric reveals attendee enthusiasm and helps optimize pricing strategies. A 60-70% early bird registration rate indicates strong initial interest.
Attendance Predictions
Registration-to-Attendance Ratio: Historical data shows that typically 70-80% of registered attendees actually show up. Track this ratio to improve capacity planning and catering decisions.
During-Event Metrics: Real-Time Success Indicators
Engagement Metrics
Session Attendance Rates: Measure how many registered attendees participate in each session. High-value content typically sees 80-90% attendance rates, while optional sessions may see 40-60%.
Audience Interaction: Track questions asked, polls participated in, and chat messages sent. Active engagement often correlates with event satisfaction and knowledge retention.
Networking Activity: For events with networking components, measure connection rates, conversation duration, and follow-up meeting bookings.
Operational Efficiency
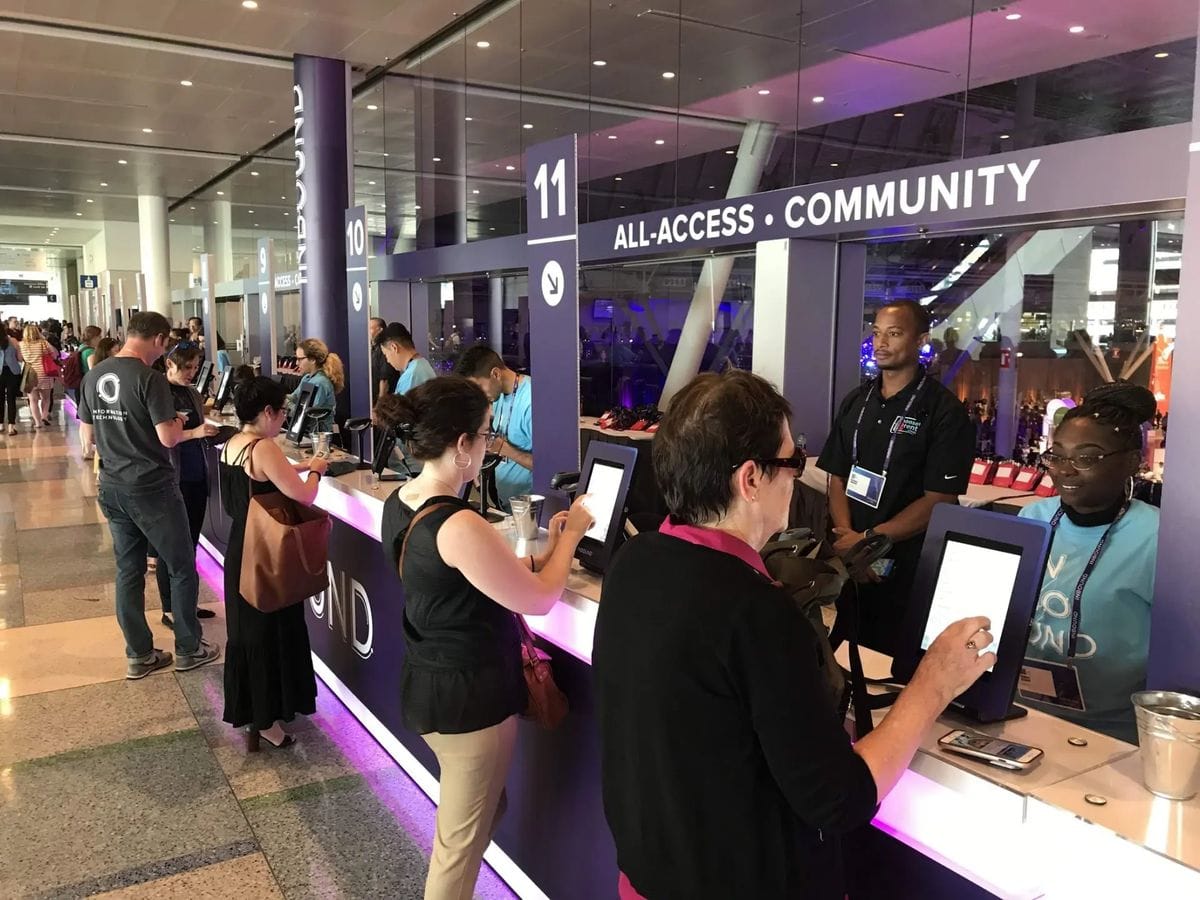
Check-in Time: Monitor average check-in duration. Efficient events maintain under 2-minute check-ins, directly impacting attendee satisfaction.
Technical Issues: Track system downtime, audio/visual problems, and platform accessibility issues. Zero tolerance for technical disruptions should be the goal.
Post-Event Metrics: Measuring Long-Term Impact
Satisfaction and Feedback
Net Promoter Score (NPS): Ask attendees how likely they are to recommend your event. Scores above 50 are considered excellent, while scores above 70 indicate exceptional experiences.
Overall Satisfaction Rating: Use a 1-10 scale to gauge general satisfaction. Successful events typically achieve ratings of 8.0 or higher.
Content Quality Scores: Rate individual sessions, speakers, and topics. This granular feedback helps optimize future programming.
Business Impact Metrics
Lead Generation: For B2B events, track qualified leads generated, business cards exchanged, and meeting requests scheduled. Quality trumps quantity in lead measurement.
Revenue Attribution: Measure direct sales resulting from the event, including immediate purchases and deals closed within 90 days post-event.
Brand Awareness Lift: Track social media mentions, website traffic increases, and brand search volume changes following your event.
Learning and Development Outcomes
Knowledge Retention: For educational events, conduct pre- and post-event assessments to measure learning objectives achievement.
Certification or Completion Rates: Track how many attendees complete required sessions or earn certifications offered during the event.
Implementation Rate: Follow up 30-60 days post-event to measure how many attendees implemented lessons learned or took recommended actions.

Advanced Analytics: Deeper Insights
Attendee Journey Mapping
Engagement Timeline: Track when attendees are most active during your event. This data helps optimize scheduling and content placement.
Drop-off Points: Identify when and where attendees disengage. High drop-off rates may indicate content issues, technical problems, or scheduling conflicts.
Comparative Analysis
Year-over-Year Growth: Compare current metrics against previous events to identify trends and improvement areas.
Benchmark Comparison: Measure your performance against industry standards and competitor events when possible.
ROI Calculation: Compare total event costs against measurable business outcomes to determine return on investment.
Technology Integration: Leveraging Event Platforms
Modern event management platforms like Venzi provide automated tracking for many of these metrics, eliminating manual data collection and reducing human error. Integration capabilities allow you to:
- Automatically capture registration and attendance data
- Monitor real-time engagement across all event touchpoints
- Generate comprehensive post-event reports
- Track long-term attendee behavior and preferences
Actionable Recommendations
For Immediate Implementation
- Establish Baseline Metrics: If you're new to event analytics, start with five core metrics: registration rate, attendance rate, satisfaction score, NPS, and lead generation.
- Create Measurement Templates: Develop standardized surveys and tracking methods to ensure consistent data collection across all events.
- Set Realistic Benchmarks: Use industry standards as starting points, but focus on beating your own previous performance.
For Long-Term Success
- Invest in Analytics Tools: Choose event management platforms that provide robust reporting capabilities and integrate with your existing marketing and sales systems.
- Train Your Team: Ensure all team members understand which metrics to track and how to interpret the data.
- Create Feedback Loops: Establish regular review cycles to analyze performance data and implement improvements for future events.
Common Pitfalls to Avoid
Vanity Metrics Trap: Don't focus solely on attendance numbers or social media likes. These metrics don't necessarily correlate with business outcomes or event success.
Analysis Paralysis: While comprehensive data is valuable, avoid tracking so many metrics that you lose focus on the most important indicators.
One-Size-Fits-All Approach: Different event types require different success metrics. A networking event's success metrics will differ significantly from a training workshop's.
The Future of Event Analytics
Event measurement continues evolving with technological advances. Emerging trends include AI-powered sentiment analysis, biometric engagement tracking, and predictive analytics for attendee behavior. However, the fundamentals remain constant: successful events create value for attendees and measurable outcomes for organizers.
Conclusion
Measuring event success requires a strategic approach that balances quantitative data with qualitative insights. By tracking the right metrics at each stage of your event lifecycle, you'll build a foundation for continuous improvement and data-driven decision making.
The most successful event organizers don't just measure success after the fact—they build measurement into every aspect of their planning and execution process. Start with the basics, expand your analytics capabilities over time, and always remember that metrics should serve the ultimate goal of creating exceptional attendee experiences.
Ready to transform your event measurement strategy? Consider how comprehensive event management platforms can automate data collection and provide the insights you need to create truly exceptional events that deliver measurable business value.
Want to elevate your event management with powerful analytics and seamless execution? Discover how Venzi's comprehensive platform can help you track, measure, and optimize every aspect of your events for maximum impact and ROI.